Close Menu
primepulsenews.com
    Instagram
    Trending
    • Co-op offers members discount on shopping after cyber attack
    • Oxfordshire mum’s education battle for ‘genius’ son
    • World-famous pianist Alfred Brendel dies aged 94
    • MPs vote to decriminalise abortion for women in England and Wales
    • Starmer picked up papers to avoid security stepping in
    • Donald Trump to extend US TikTok ban deadline, White House says
    • Opening of HS2 line set to be delayed beyond 2033
    • Russia fears another loss in Middle East from Iran’s conflict with Israel
    Instagram
    primepulsenews.com
    Saturday, June 21
    • Home
    • Top Stories
    • World News
    • Business
    • Politics
    • Health
    • Education & Family
    • Markets
    • Entertainment & Arts
    • Science & Environment
    • Technology
    primepulsenews.com
    Top Stories

    Canada election 2025 results in charts

    PrimePulseNewsBy PrimePulseNewsApril 29, 2025No Comments3 Mins Read
    Canada election 2025 results in charts

    Phil Leake, Alison Benjamin, Daniel Wainwright and Jess Carr

    Data journalism team

    BBC An illustration showing an white outline of a map of Canada in front of black bars and a red background.BBC

    Mark Carney’s Liberal Party is expected to win enough seats in the House of Commons to form a government in Canada. It is not yet clear whether it will be able to secure a majority.

    Carney is set to remain prime minister, having only assumed the role in early March following Justin Trudeau’s resignation.

    Carney’s Liberals are leading in 168 seats but are currently short of the 172 needed for a majority.

    The Conservatives, led by Pierre Poilievre, are set to remain in opposition as the second-largest party and are leading in 144 seats, with 99% of polls having reported results.

    Bloc Québécois – is leading in 23 seats and only runs candidates in the province of Quebec. The NDP is leading in seven seats and the Green Party in one.

    Both the Liberals and the Conservatives have seen a significant rise in their share of the national vote compared with four years ago.

    Increased support for Canada’s two largest parties has come at the expense of smaller parties, particularly the New Democratic Party (NDP) whose share of the popular vote is down by around 12 percentage points.

    The NDP’s leader, Jagmeet Singh, has lost his own seat in the House of Commons and came third behind the Liberal and Conservative candidates.

    Canada has a “first-past-the-post” electoral system.

    The candidate who gets the most votes in each electoral district, or riding, wins that seat and become a Member of Parliament (MP).

    The Liberals and the Conservatives have dominated the popular vote, with both parties receiving more than 40% each of ballots counted across Canada so far.

    This has them on track to win a combined 90% of seats.

    The NDP has received just over 6% of the total vote declared so far, but this translates to just 2% of seats in the House of Commons.

    Bloc Québécois has just over 6% of the vote and a similar share of seats.

    A map showing the number of seats won by each party across Canada’s 13 provinces. Seats are broken down as follows:
Ontario - Liberal 69 seats, Conservative 53
Quebec - Liberal 43 seats, Bloc Quebecois 23, Conservative 11, NDP 1
British Columbia - Conservative 20 seats, Liberal 19, NDP 3, Green 1
Alberta - Conservative 34 seats, Liberal 2, NDP 1
Manitoba - Conservative 7 seats, Liberal 6, NDP 1
Saskatchewan - Conservative 13 seats, Liberal 1
Nova Scotia - Liberal 10 seats, Conservative 1
New Brunswick - Liberal 6 seats, Conservative 4
Newfoundland and Labrador - Liberal 5 seats, Conservative 2
Prince Edward Island - Liberal 4 seats
Northwest Territories - Liberal 1 seat
Yukon - Liberal 1 seat
Nunavut - NDP 1 seat

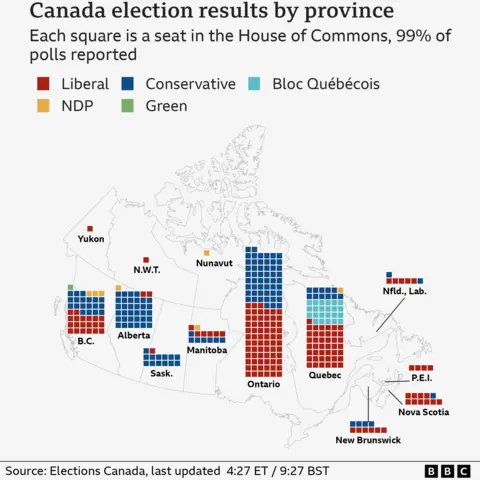
    The Liberals are on course to win the most seats in the key provinces of Ontario and Quebec, which account for 200 of Canada’s 343 electoral districts.

    The Conservatives are ahead in Alberta, while there is little to choose between the two main parties in British Columbia.

    Turnout at Canadian federal elections
Percentage of registered electors that voted, 2004 to 2025
2004:	61
2006:	65
2008:	59
2011:	61
2015:	68
2019:	67
2021:	66
2025:	67
Source: Elections Canada
Note: 2025 results are provisional and based on results from 99% of polls. Does not include electors who registered on election day.
Last updated 4:30 ET / 9:30 BST

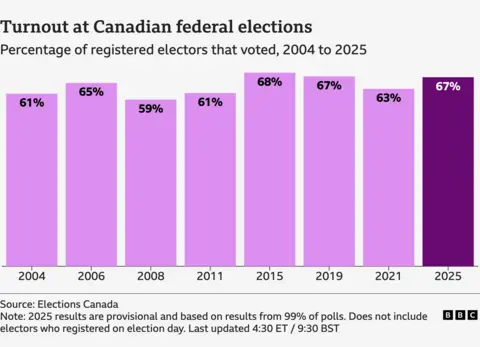
    About two-thirds of registered electors voted, according to the preliminary results from Elections Canada. This is in up on the last election in 2021 and similar to 2015 and 2019.

    More than 7 million Canadians cast their ballots in advance, setting a new record for early voter turnout, Elections Canada said.

    The words "Canada election" on a red background with a white maple leaf
    Canada charts election results
    PrimePulseNews
    • Website

    Related Posts

    Opening of HS2 line set to be delayed beyond 2033

    June 18, 2025

    Israeli forces kill 51 Palestinians waiting for flour at Gaza aid site, witnesses and rescuers say

    June 17, 2025

    ‘A generation let down’ and ‘Israel claims control’

    June 17, 2025

    UK weather: First heatwave of 2025 likely as temperatures surge above 30C

    June 16, 2025

    ‘Retreat over grooming gangs’ and ‘Say sorry for delay’

    June 16, 2025

    Person hurt in airport car park incident

    June 15, 2025
    Add A Comment
    Leave A Reply Cancel Reply

    Categories
    • Business
    • Education & Family
    • Entertainment & Arts
    • Health
    • Markets
    • Politics
    • Science & Environment
    • Technology
    • Top Stories
    • World News
    Instagram
    • Privacy Policy
    • Terms and Conditions
    • Contact Us
    • About Us
    © 2025 primepulsenews. Designed by webwizards7.

    Type above and press Enter to search. Press Esc to cancel.